In order to understand the fundamental principles of vibrational spectroscopy, one can imagine, as a matter of simplification, each molecule as a collection of several spheres (the atoms) and connecting elastic springs (atomic bonds). The connected balls can vibrate along each spring. The respective vibrations are dependent on the spring, the spheres involved and the angle between the springs and are highly characteristic. The resulting oscillation spectra can be measured in the infrared spectral range in absorption and with the Raman spectroscopy in scatter.
In contrast to this classical model (ball-spring), discrete vibrational levels are stimulated in the quantum mechanical model. Therefore, they are also referred to as vibrational spectra. In the figure above, the stretching and bending vibration of the water molecule and the two resulting IR absorption bands are shown. These two bands are characteristic of a water molecule. The resulting spectra are therefore characteristic of the respective molecule and the same fingerprints, by means of which the molecules can be identified in a label-free manner.
In the case of small molecules, the individual bands can be clearly assigned to the respective vibrations of the molecule. In the case of proteins, the bands of the active center can be selected from the background absorption of the total protein by means of FTIR difference spectroscopy. Static FTIR difference spectroscopy was introduced by Siebert, Mäntele and Gerwert in 1983 (Siebert et al. 1983). Thereby, an intermediate is frozen at low temperatures. For the first time, the individual difference bands could clearly be assigned to specific molecular groups, such as aspartic acids by means of isotopic labeling (Engelhard, Gerwert et al. 1985 and Gerwert et al. 1986) or even more precisely a single aspartic acid by site-specific mutagenesis (Gerwert et al. 1989).
This was the crucial breakthrough of the method, which was initially seen very critically because only very small changes are selected ahead of the strong background absorption of the entire protein, similar to a needle in a haystack. An important next milestone was the establishment of time-resolved FTIR difference spectroscopy, which allows simultaneous measurements of the different reactions in a protein at room temperature and thus the protein dynamics (Gerwert 1988, Gerwert et al. 1990). Based on the time-resolved FTIR spectroscopy, it is now possible to produce movies of the protein dynamics complementary to the X-ray structure analysis, which provides static images of the ground state. The precise simultaneous start of the protein reactions is crucial in difference spectroscopy. Therefore, this method is particularly well suited for proteins with chromophores because the reaction can be started with a laser flash in these cases. By introducing photolabile, so-called "caged" compounds such as caged GTP, the method could be extended to non-chromophoric proteins (Cepus et al. 1998).
In cells and tissues, so many bands of the proteins, the DNA and RNA, the lipids and other groups in the spectrum overlap that individual bands can no longer be assigned specifically. However, the FTIR spectra form a "fingerprint" which integrally reflects the proteome and genome. If the spectra are measured spatially resolved using a microscope and the different spectra are spatially resolved assigned to different colors, a label-free index color image of the cell or the tissue is obtained. In this pattern recognition, the bioinformatic evaluation with unsupervised and supervised classifiers plays a central role. The different colors then distinguish different molecular areas. With the help of Raman and CARS microscopy, cells can be classified in a label-free manner. With the help of IR microscopy, particularly tissue can be annotated in a label-free manner.
(2) Siebert, F., Mäntele, W., Gerwert, K.
Fourier-transform infrared spectroscopy applied to rhodopsin. The problem of the protonation state of the retinylidene Schiff base reinvestigated
Eur. J. Biochemistry 136, 119-127 (1983).
(4) Engelhard, M., Gerwert, K., Hess, B., Kreutz, W., Siebert. F).
Light-driven protonation changes of internal aspartic acids of bacterio-rhodopsin: An investigation by static and time-resolved infrared difference spectroscopy using [4-13C] aspartic acid labeled purple membrane
Biochemistry 24, 400-407 (1985).
(8) Gerwert, K., Siebert, F.
Evidence for light-induced 13-cis, 14-s-cis, isomerization in bacteriorhodopsin obtained by FTIR difference spectroscopy using isotopically labelled retinals
EMBO Journal 5, 805-811 (1986).
(13) Gerwert, K.
Intramolekulare Proteindynamik untersucht mit zeitaufgelöster Fourier Transform Infrarot-Differenzspektroskopie
Ber. Bunsenges. Phys. Chem. 92, 978-982 (1988).
(19) Gerwert, K., Hess, B., Soppa, J., Oesterhelt, D.
The role of Asp 96 in the proton pump mechanism of bacteriorhodopsin.
Proc. Natl. Acad. Sci. USA 86, 4943-4947 (1989).
ATR-FTIR spectroscopy is a surface-based technique that allows label-free and time-resolved analysis of protein-ligand interactions in the same way as done with the widely used SPR (surface plasmon resonance) spectroscopy. Because of the spectral resolution of infrared spectroscopy additionally the complete molecular information of protein-ligand interaction at every time point can be obtained (Kötting et al. 2012).
In the ATR technique, the infrared beam reflects within a high refractive index medium namely the internal reflection element (IRE). At the interface, a so-called evanescent field is formed which extends into the surrounding medium approximately 1 µm and interacts with the protein immobilized on the IRE. The ATR technology thus allows the measurement of liquids in a flow system in the infrared spectral range.
By forming membrane monolayers of natural lipids on the IRE and the in situ attachment of lipid-anchored Ras, this peripheral membrane protein could be investigated by infrared spectroscopy in a more native environment. It was shown that membrane-bound N-Ras has an upright molecular orientation. Simultaneous FRET studies have shown that N-Ras is membrane-bound as a dimer. This was a cover story in the Biophysical Journal (Güldenhaupt et al. 2012). Protein-protein interactions have also been investigated with the ATR system. For example, the membrane extraction of the GTPase Rab by a GDI was detected (Gavriljuk et al. 2013).
The freely accessible ATR surface allows targeted manipulation of the immobilized proteins, for example by the addition of ligands. These monolayers, which contain only a few µg of protein, can be used, e.g. by using multiple reflections, to detect very small conformational changes of the immobilized proteins and to investigate molecular reaction mechanisms (Pinkerneil et al. 2012, cover story). At the same time, the intrinsic polarization of the evanescent field is used to perform orientation analyses of monolayers of immobilized proteins and lipids.
The specific immobilization of proteins on the IRE is achieved in our department through different surface chemical techniques, which always work as a layer by layer modification of the ATR surface under simultaneous online spectral control. Thereby the first layer is a monolayer of thiols or silanes (SAM, self assembled monolayer), which form a covalent bond to the previously activated germanium surface of the ATR crystal (Schartner et al. 2013). The second layer is the protein interaction layer, which is coupled in the measurement cell to the SAM by means of NHS, maleimido or click chemistry. The protein interaction layer can consist of NTA groups, streptavidin or antibodies so that any HisTag, StrepTag or biotin-bearing proteins, or any protein compatible with the antibody used, can be immobilized.
The resulting surface concentration of the immobilized protein allows for time-resolved detection of ligand induced conformational changes in the time domain 10 s - 10 h (K4DD).
The antibody immobilization additionally allows certain disease-relevant marker proteins to be captured highly specific from complex liquids (e.g. blood plasma). On this basis we developed an immuno-ATR biosensor for diagnosis of Alzheimer's disease.
(136) Kötting, C., Güldenhaupt, J., Gerwert, K.
Time-resolved FTIR spectroscopy for monitoring protein dynamics exemplified by functional studies of Ras protein bound to a lipid bilayer
Chemical Physics, 396, 72-83 (2012)
(140) Pinkerneil, P., Güldenhaupt, J., Gerwert, K., Kötting, C.
Surface attached polyhistidine-tag proteins characterized by FTIR difference spectroscopy
ChemPhysChem 2012, 13, 2649 – 2653
(144) Güldenhaupt, J., Rudack, T., Bachler, P., Mann, D., Triola, G., Waldmann, H., Kötting, C. and Gerwert, K.
N-Ras Forms Dimers at POPC Membranes
Biophys. J. 103, 1585-1593 (2012)
Supporting Material
(149) Schartner, J., Güldenhaupt, J., Mei, B., Rögner, M., Muhler, M., Gerwert, K., Kötting, C.
Universal Method for Protein Immobilization on Chemically Functionalized Germanium Investigated by ATR-FTIR Difference Spectroscopy
J. Am. Chem. Soc. 135, 4079-4087 (2013)
(155) Gavriljuk, K., Itzen, A., Goody, R. S., Gerwert, K., Kötting, C.
Membrane extraction of Rab proteins by GDP dissociation inhibitor characterized using attenuated total reflection infrared spectroscopy
Proc. Natl. Acad. Sci., 110, 13380-13385 (2013)
Supporting Material
(174) El-Mashtoly, S.F., Yosef, H.K., Petersen, D., Mavarani, L., Maghnouj, A., Hahn, S.A., Kötting, C., Gerwert, K.
Label-free Raman spectroscopic imaging monitors the integral physiologically relevant drug responses in cancer cells
Anal. Chem. 87 (2015) 7297-7304
Supporting Material
Raman microscopy enables label-free chemical imaging. It is based on inelastic scattering of photons when light shines on a molecule. The Raman spectrum of each molecule reflects the molecule´s chemical structure implying that each molecule has its own Raman signatures (fingerprint).
Spontaneous Raman spectral imaging provides a powerful non-destructive means with high molecular specificity and high spatial resolution (few hundred nanometers), which are very essential for in vivo imaging of for instance living cells. This technique is based on the identification of molecular vibrations that are distinct for all major species in cells such as proteins, nucleic acids, lipids, phospholipids, and carbohydrates as well as a variety of molecules such as drugs or metabolites. However, spontaneous Raman imaging is relatively slow since Raman scattering just provides weak signals (Figure 1). Coherent anti-Stokes Raman scattering (CARS) enables the enhancement of the weak Raman signal due to nonlinear excitation (Figure 1). Thus, CARS imaging is fast and can be performed at a speed up to a video rate.
We use these label-free imaging techniques in combination with chemometric analysis for the evaluation of targeted cancer therapy and cancer diagnosis.
The technique behind FTIR/Raman imaging is the collection of spatially resolved vibrational spectra. These vibrational spectra represent the chemical composition of the underlying tissue. We use these advanced imaging techniques to analyze different human tissue samples. Spectra taken from these samples are used as an integral marker (proteome, genome, transcriptome and metabolome) of the biochemical status of the tissue at the moment of collection. The spectra form patterns which are characteristic for the molecular state, the same way a fingerprint is characteristic for a person.
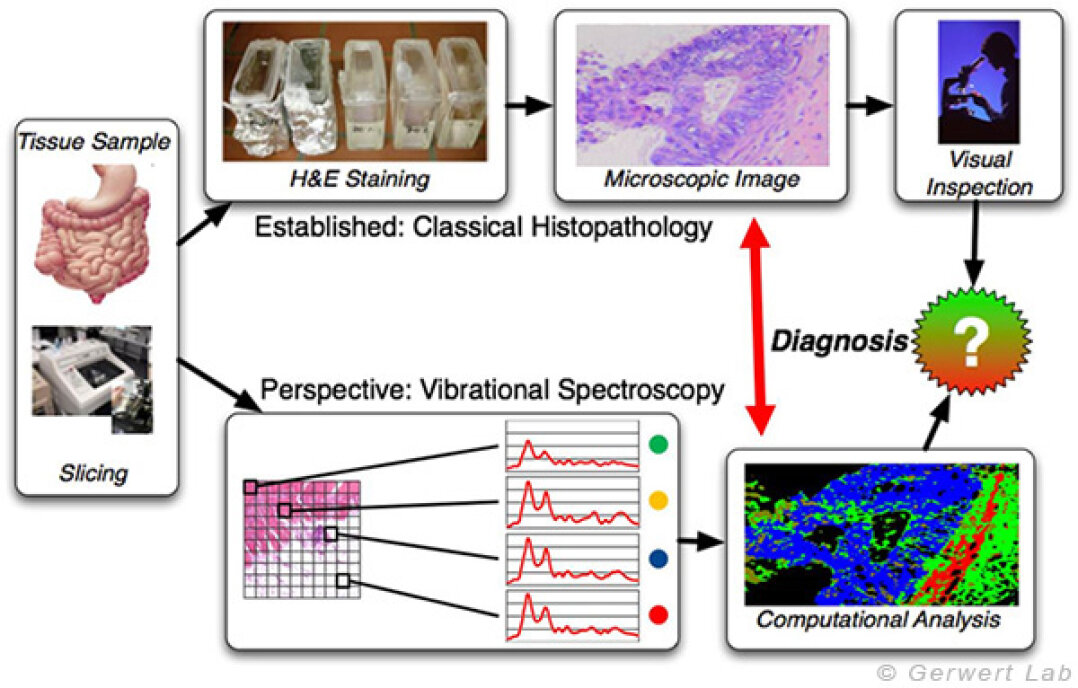
The first figure indicates the workflow of the classic histopathology compared to the classification of tissue using FTIR/Raman imaging. FTIR/Raman imaging as a label-free technique does not require any staining of the sample. Spatially resolved spectra are measured and the sample remains unmodified. By comparison with a spectral database, a label-free, automated classification of tissue is possible. This approach is established for tumors of the colon, lung and bladder at the Department of Biophysics. In comparison to the clinical gold standard, the histopathology, we reach a sensitivity and a specificity of over 95% for these three entities.
FTIR imaging is performed with FTIR microscopes, using special FPA (focal plane array) detectors consisting of 64x64 or even 128x128 elements. This setup allows the simultaneous spatially resolved measurement of large tissue sections. By means of further technical modifications, a fast and continuous data collection can thus be carried out.
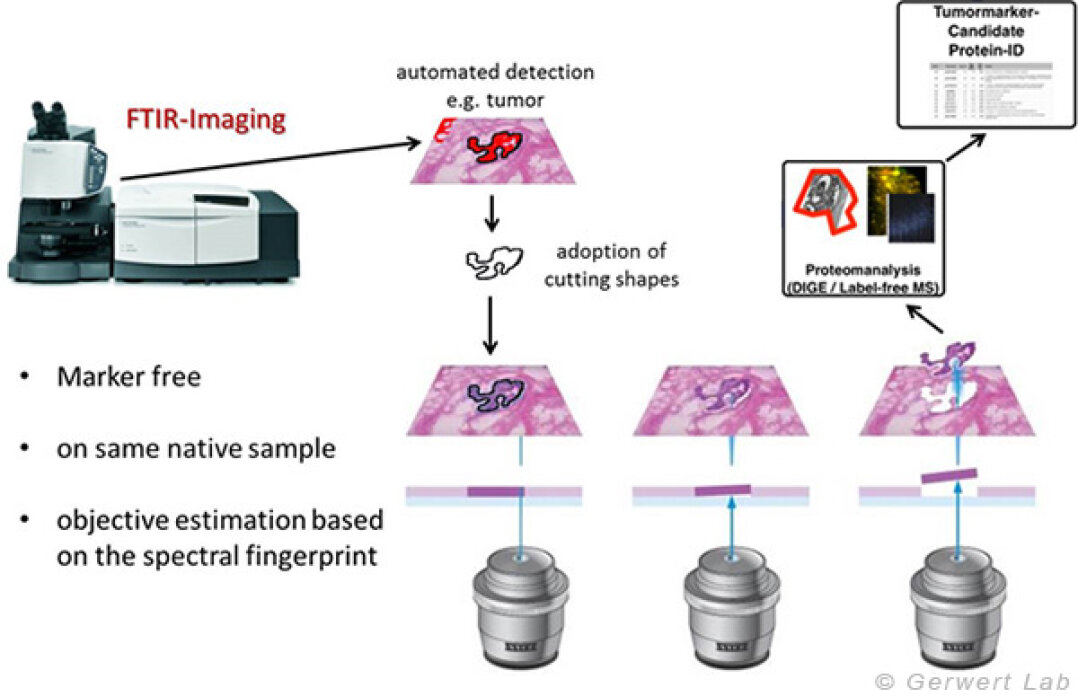
In addition to the use as a diagnostic tool, FTIR/Raman imaging can be used to search for biomarkers due to its robust, spatially resolved and observer independent characterization of untreated tissue samples. In our group, we have developed a unique method that uses the spatially resolved tissue detection of the FTIR imaging to collect samples for omics techniques using laser microdissection (LMD). This allows us, in the field of biomarker search, to work on very precisely annotated but still untreated samples for the first time.


Defects in the folding of proteins lead to neurodegenerative diseases such as Alzheimer's and Parkinson's. Therefore, the folding state or proteins can be used as a biomarker for the diagnosis of neurodegenerative diseases in these cases. We have developed an ATR-based immuno-sensor for Alzheimer's diagnostics. This has already been awarded prizes. It can be extended to other neurodegenerative diseases, especially for the diagnosis of Parkinson's disease.
Neurodegenerative Diseases
The most leading causes of dementia can be attributed to Parkinson's and Alzheimer's disease. Thereby, Alzheimer's disease affects around 1.5 million people in Germany. A feature characteristic of most neurodegenerative diseases is the misfolding of body own proteins into β-sheet enriched structures, which aggregate and form insoluble amyloidogenic plaques (Amyloid-β, Alzheimer's disease), neurofibrillary tangles (tau), or Lewy bodies (α-Synuclein, Parkinson's disease) in the brain. This misfolding process is supposed to occur years before clinical symptoms manifest.
Alzheimer's disease diagnosis based on liquid biopsies
The workgroup medical biophotonics developed an immuno-infrared-sensor (patent pending) which allows the high specific detection of the secondary structure distribution of the soluble Aβ fraction in cerebrospinal fluid and blood for the first time. However, the ratio of non-toxic monomeric to toxic β-sheet rich Aβ isoforms changes in body fluids during Alzheimer's disease progression. The secondary structure distribution of the overall Aβ fraction in body fluids is detected by the novel immuno-infrared-sensor and a robust spectral threshold is used for Alzheimer's disease differentiation. In the near future, this sensor will also be applied for Parkinson's disease detection.
The overall accuracy of a blood based Alzheimer's disease diagnosis was obtained with 84% (specificity 88%, sensitivity 75%). In addition, current research studies indicate that the immuno-infrared-assay is also capable for the detection of preclinical disease stages.
All projects are performed in close contact with cooperation partners from the research community and industry.
Patent:
K. Gerwert, J. Wiltfang, J. Ollesch, A. Nabers, J. Schartner, and C. Kötting
"Biosensor for Conformation and Secondary Structure Analysis"
WO 2015/121339, 2015.
(172) Nabers, A., Ollesch, J., Schartner, J., Kötting, C., Genius, J., Haußmann, U., Klafki, H., Wiltfang, J., Gerwert, K.
An infrared sensor analysing label-free the secondary structure of the Abeta peptide in presence of complex fluids
J Biophotonics. 2016 Mar;9(3):224-34. doi: 10.1002/jbio.201400145
(178) Nabers, A., Ollesch, J., Schartner, J., Kötting, C., Genius, J., Hafermann, H., Klafki, H., Gerwert, K., Wiltfang, J.
Amyloid-ß-Secondary Structure Distribution in Cerebrospinal Fluid and Blood Measured by an Immuno-Infrared-Sensor: A Biomarker Candidate for Alzheimer's Disease
Anal. Chem. 2016, 88, 2755-2762
Supporting Material
The aim of Kinetics for Drug Discovery (K4DD) is to determine the kinetics of the drug-protein interaction by establishing, validating and optimizing a series of measurement protocols and measurement techniques to measure the kinetics more reliably and to predict the in vivo efficacy from the kinetics. The K4DD consortium consists of 20 partners from 6 European countries. K4DD is funded by the Innovative Medicine Initiative Joint Undertaking (IMI JU). The total funding amounts to 21 Mio. €.
It has emerged in recent years that the kinetics of drug-protein interaction is a decisive factor in the development of new drugs, in particular the koff rate, which indicates how long an agent interacts with the target protein. This rate has been neglected so far, but appears to be a very important factor for efficacy.
Upon binding of a drug molecule to its target protein, a structural change of the protein is caused in about 30% of the drugs. These conformational changes lead to a modified interaction of the target protein in the cell and are thus decisive for the pharmacological effect. Since different drugs can also cause different protein conformations, the detection of the conformational change activity is an important parameter for the drug development, which was very time-consuming and cost-intensive to determine so far.
By using ATR-FTIR spectroscopy in combination with a flow cell, we are able to detect the conformational change activity of a drug within a few minutes and to determine the important koff rate in addition. This is possible because of a combination of the automation of the ATR setup developed at the Department of Biophysics, which allows precise control of the measurement sequences of 10-hour duration and the surface-chemical modifications of the ATR crystals established at the chair (Schartner et al. 2013, Schartner et al. 2014). The cooperation within the K4DD consortium allows us to access a variety of target proteins, including the associated inhibitor libraries, for which also X-ray structures of the protein-inhibitor complexes and kinetic and thermodynamic data are provided. This excellent base of reference data makes it possible to interpret the infrared difference spectra in detail and to additionally validate the extracted koff rates. ATR-FTIR spectroscopy is an important new tool for drug development.
The association EFPIA represents the interests of approx. 2200 researching pharmaceutical companies, among others the Verband Forschender Arzneimittelhersteller and many individual companies such as AstraZeneca, Bayer Healthcare, Boehringer Ingelheim, GlaxoSmithKline, Johnson & Johnson, Merck, Novartis, Pfizer, Recordati Roche, Sanofi-Aventis.
(149) Schartner, J., Güldenhaupt, J., Mei, B., Rögner, M., Muhler, M., Gerwert, K., Kötting, C.
Universal Method for Protein Immobilization on Chemically Functionalized Germanium Investigated by ATR-FTIR Difference Spectroscopy
J. Am. Chem. Soc. 135, 4079-4087 (2013)
(174) El-Mashtoly, S.F., Yosef, H.K., Petersen, D., Mavarani, L., Maghnouj, A., Hahn, S.A., Kötting, C., Gerwert, K.
Label-free Raman spectroscopic imaging monitors the integral physiologically relevant drug responses in cancer cells
Anal. Chem. 87 (2015) 7297-7304
Supporting Material
Numerous diseases such as cancer are caused by altered protein interactions in the cell. The aim of our projects at the cellular level is the development of label-free Raman and CARS microscopy in combination with chemometric methods as an innovative method for cell diagnostics.
For example, bladder cancer can be identified using cells from body fluids (see: "spectral cytopathology").
We also develop an in vitro assay based on cell-lines to determine whether a particular cancer drug is effective on patients or not. This approach is used for the label-free investigation of pharmacokinetics within the framework of "companion diagnostics".
Evaluation of targeted cancer therapy by Raman micro-spectroscopy
Evaluation of the potency and efficacy of drug candidates in vitro is essential during early stages of drug discovery. Both spontaneous Raman and coherent anti-Stokes Raman scattering (CARS) can be used as label-free and non-invasive screening tools for drug evaluation. To set the stage to use these methods as screening tools, an automated recognition of subcellular organelles of cancer cells is performed. For instance, nucleus, nucleoli, lipid droplets, endoplasmic reticulum, Golgi apparatus, and mitochondria can be recognized in a label-free manner (El-Mashtoly et al. 2015, Krauß et al. 2015, El-Mashtoly et al. 2014).
Raman spectral imaging is used to detect the response of subcellular organelles to targeted cancer therapy such as EGFR inhibitors. Cellular response to inhibitors can be also monitored in cells with oncogenic KRas mutations (El-Mashtoly et al. 2015, Yosef et al. 2015). Furthermore, the spatial distribution and metabolism of tyrosine kinase inhibitors in cancer cells can be detected (El-Mashtoly et al. 2014). Basically Raman microscopy shows the potential to be used to investigate pharmacokinetics in living cells.
(160) El-Mashtoly, S.F., Petersen, D., Yosef, H.K., Mosig, A., Reinacher-Schick, A., Kötting, C., Gerwert, K.
Label-free imaging of drug distribution and metabolism in colon cancer cells by Raman microscopy
Analyst 139, 5 (2013) 1155-1161
(161) El-Mashtoly, S.F., Niedieker, D., Petersen, D., Krauss, S.D., Freier, E., Maghnouj, A., Mosig, A., Hahn, S., Kötting, C., Gerwert, K.
Automated Identification of Subcellular Organelles by Coherent Anti-Stokes Raman Scattering
Biophysical Journal 106 (2014), 1910-1920
(171) Krauß, S.D., Petersen, D., Niedieker, D., Fricke, I., Freier, E., El-Mashtoly, S.F., Gerwert, K., Mosig, A.
Colocalization of fluorescence and Raman microscopic images for the identification of subcellular compartments: a validation study
Analyst, 2015 (140) 2360-2368
(174) El-Mashtoly, S.F., Yosef, H.K., Petersen, D., Mavarani, L., Maghnouj, A., Hahn, S.A., Kötting, C., Gerwert, K.
Label-free Raman spectroscopic imaging monitors the integral physiologically relevant drug responses in cancer cells
Anal. Chem. 87 (2015) 7297-7304
Supporting Material
(175) Hesham, K.Y., Mavarani, L., Maghnouj, A., Hahn, S., El-Mashtoly, S.F., Gerwert, K.
In vitro prediction of the efficacy of molecularly targeted cancer therapy by Raman spectral imaging
Anal Bioanal Chem., DOI 10.1007/s00216-015-8875-z
Supporting Material
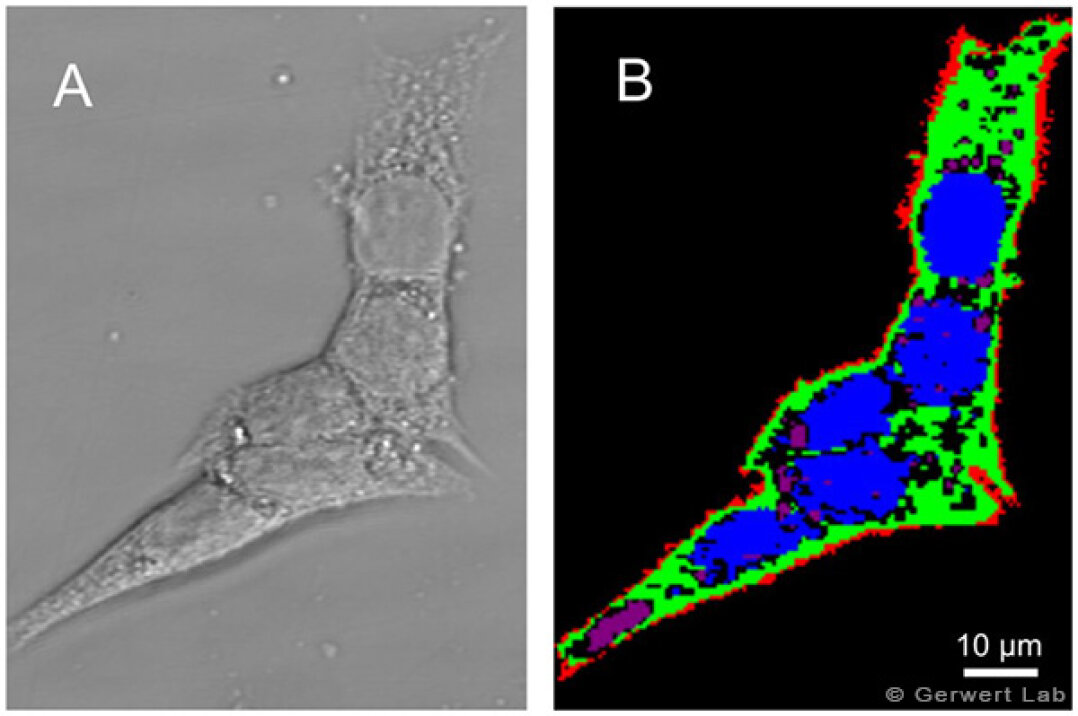


Diagnosis of cancer in body fluids by Raman spectral cytopathology
Spectral Cytopathology (SCP) is a non-invasive method for identifying cancer cells in body fluids such as urine. Conventional cytological methods are using light microscopy to detect the presence of cancer cells depending only on morphological features. These tests have many disadvantages such as requiring a trained pathologist, being time consuming, and offering low reproducibility. We are developing Raman/CARS based SCP, which is a rapid, simple and reproducible method to analyse body fluids for the diagnosis of cancer.
The technique behind FTIR/Raman imaging is the collection of spatially resolved vibrational spectra. These vibrational spectra represent the chemical composition of the underlying tissue. We use these advanced imaging techniques to analyze different human tissue samples. Spectra taken from these samples are used as an integral marker (proteome, genome, transcriptome and metabolome) of the biochemical state of the tissue at the moment of collection. The spectra form patterns which are characteristic for the molecular state, the same way a fingerprint is characteristic for a person.
After a tissue sample has been taken, it is cut into thin, microscopic slices (1-10 µm). In classical histopathology, these are now stained and viewed using a microscope. The pathologist then decides which diagnosis is made for the patient based on his experience and given criteria. In FTIR imaging, the tissue is not stained but measured in a spatially resolved manner. The obtained spectra of unknown tissue are classified and a color is assigned to each class. The resulting index color image is now compared to the histopathological findings. Tissue-specific spectra are subsequently stored in a database which can be used to characterize unknown tissue sections (monitored classification). After successful establishment of a spectral database, an automated characterization of an unknown tissue is possible and can support the diagnosis of the pathologist.
FTIR imaging is performed with FTIR microscopes, using special FPA (focal plane array) detectors consisting of 64x64 or even 128x128 elements. This setup allows the simultaneous spatially resolved measurement of large tissue sections. By means of further technical modifications, a fast and continuous data collection can thus be carried out. In our previous studies, we have established FTIR imaging for highly specific tissue recognition, especially on intestine, bladder and lung. More recently, the brain and the muscle have been added.
In addition to the use as a diagnostic tool, FTIR/Raman imaging can be used to search for biomarkers due to its robust, spatially resolved and observer independent characterization of untreated tissue samples. In our group, we have developed a unique method that uses the spatially resolved tissue detection of the FTIR imaging to collect samples for omics techniques using laser microdissection (LMD). This allows us, in the field of biomarker search, to work on very precisely annotated but still untreated samples for the first time. First results will be published this year.


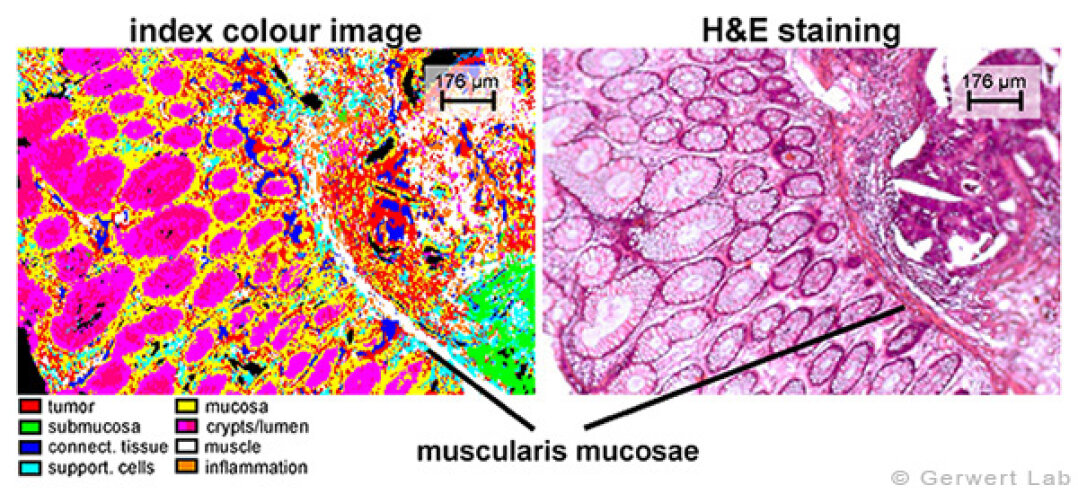
Colorectal cancer is one of the most common cancer forms in Germany with ascending numbers due to the rising mean age of the population. In cooperation with the clinical institutes of the Ruhr-University Bochum, especially the Institute of Pathology, we investigate colorectal cancer within the projects PURE and ColoPredict Plus. A spectral databank has been established. FTIR and Raman imaging provides characterization of colorectal tissue sections with high accuracies (> 96 %). Even most subtle structures, as for example the lamina muscularis mucosae - a small gracile muscle which is important for diagnosing the progression stadium of a tumor - can be resolved. Cancerous regions are indicated in red - for clarity the further on H&E stained sample is shown aside.
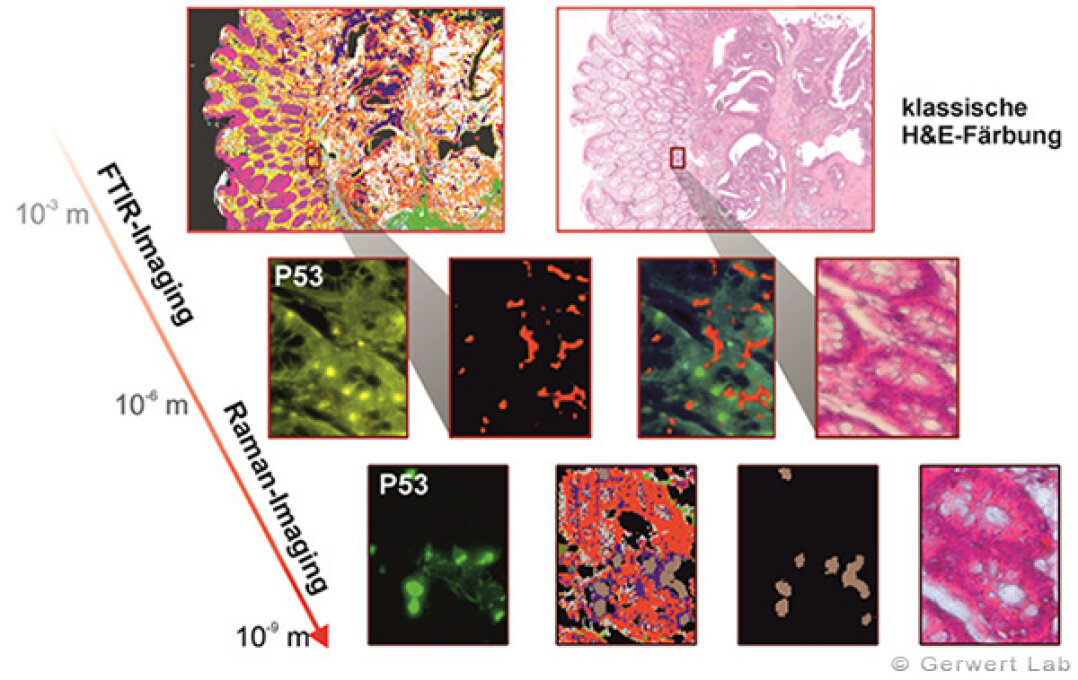
With increasing magnification, the spatial limits of FTIR imaging on cell level - given by the used wavelength - have been reached. By combination with the higher spatial resolution of Raman imaging, we were able to push the frontiers of spectral imaging to subcellular level. This approach allows us to adress questions requiring high resolution techniques (see figure on right side). Here, we characterized high proliferating nuclei in goblet cells within morphologically healthy looking crypts (indicated in ochre - and colocalized with IHC stainings).
In modern histopathology, the challenge of a precise discriminative and individual diagnostic - supported by immunohistochemical and biochemical techniques as sequencing - gains more and more importance. Therefore, we achieved a precise discriminative analysis of the tumor grading in colorectal cancer by using FTIR imaging (see figure).
(148) Kallenbach-Thieltges, A., Großerüschkamp, F., Mosig, A., Diem, M., Tannapfel, A., Gerwert, K.
Immunohistochemistry, histopathology and infrared spectral histopathology of colon cancer tissue sections
J. Biophotonics, 6 (1), 88-100 (2013)
(152) Mavarani, L., Petersen, D., El-Mashtoly, S.F., Mosig, A., Tannapfel, A., Kötting, C. and Gerwert, K.
Spectral Histopathology of colon cancer tissue sections by Raman imaging with 532 nm excitation provides label free annotation of lymphocytes, erythrocytes and proliferating nuclei of cancer cells
Analyst, 2013, 138, 4035–4039 (2013)
(180) Kuepper, C., Großerueschkamp, F., Kallenbach-Thieltges, A., Mosig, A., Tannapfel, A., Gerwert, K.
Label-free classification of colon cancer grading using infrared spectral histopathology
Faraday Discussion, DOI 10.1039/C5FD00157A


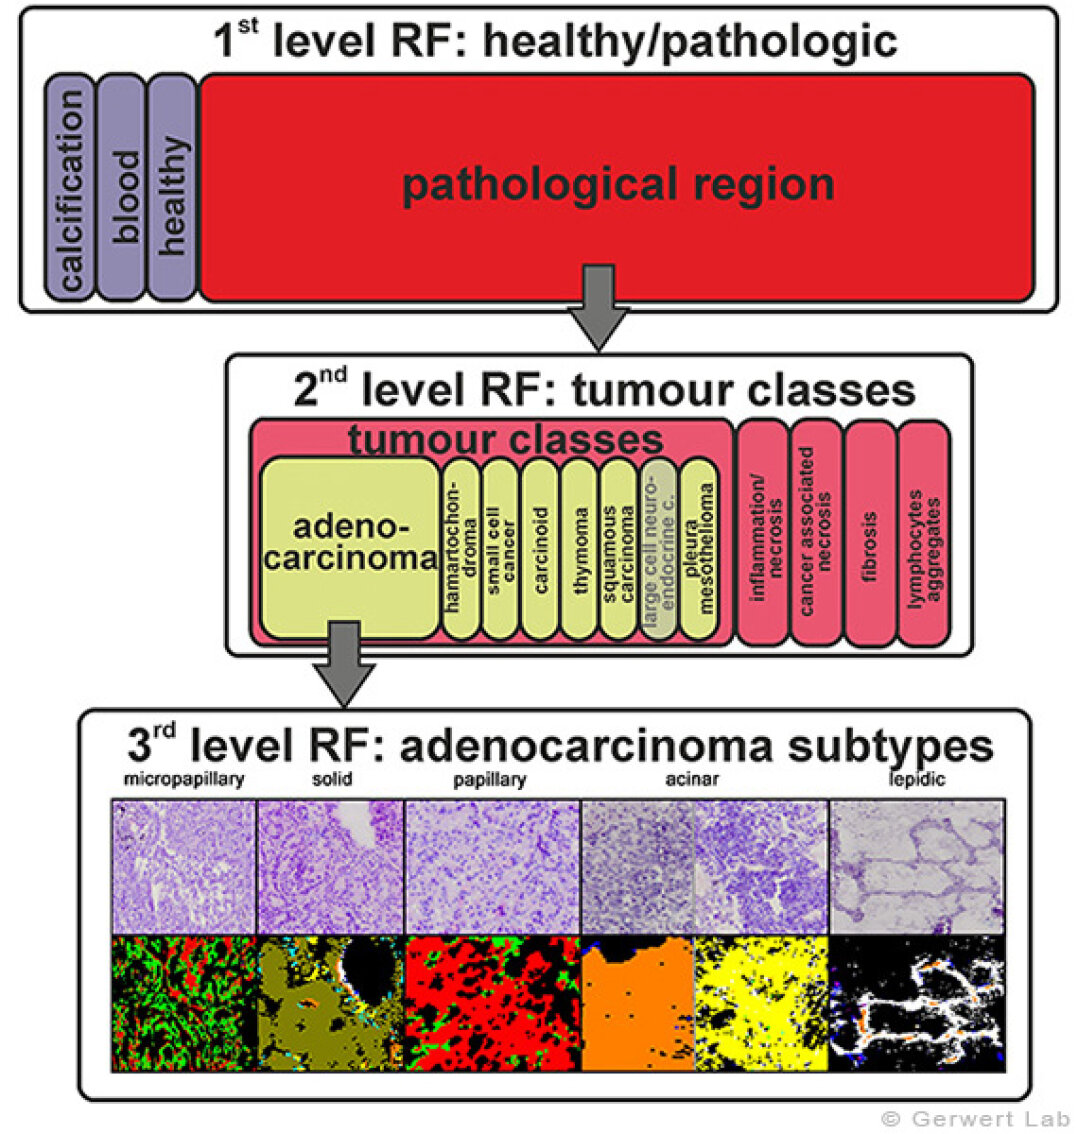
Lung cancer is one of the cancer types bringing the poorest prognosis to patients. On the one hand, that's due to the complex nature of a lung tumor and on the other hand symptoms tend to occur late in progression ruining the chance of an early detection. Lung cancer is investigated within a project funded by the German social accident insurance (DGUV). We aim for diagnostic markers for characterizing lung cancer. We were able to establish an automated annotation of lung cancer and infiltrating tumors (e.g. mesothelioma of pleura) with an accuracy of > 94 %. To raise the prognostic value of our system even more, we added an annotation of tumor subtypes. Thus, we were the first group worldwide to establish an automated annotation of adenocarcinoma subtypes on thin tissue sections. In descending order regarding mortality these are: micropapillary, solid, papillary, acinar and lepedic carcinoma. Till now the diagnosis of these subtypes is done by complex immunohistochemical stainings bearing a comparable high rate of false classification.
The extraordinary high heterogeneity of lung cancer tumors is quite a challenge in collecting biochemical information and ultimately identifying biomarker candidates. Our unique approach of combining FTIR imaging with laser capture microdissection will allow us to acquire samples for further analysis with unrivalled accuracies. First experiments have been performed showing promising results. A method for precise molecular characterization of tissue samples lies now in our hands and finding good biomarker candidates is only small steps ahead.
(167) Großerüschkamp, F., Kallenbach-Thieltges, A., Behrens, T., Brüning, T., Altmayer, M., Stamatis, G., Theegarten, D., Gerwert, K.
Marker-free automated histopathological annotation of lung tumour subtypes by FTIR imaging
Analyst, 2015, 140, 2114–2120
(182) Ollesch, J., Theegarten, D., Altmayer M., Darwiche, K., Hager, T., Stamatis, G., Gerwert, K.
An infrared spectroscopic blood test for non-small cell lung carcinoma and subtyping into pulmonary squamous cell carcinoma or adenocarcinoma
Biomedical Spectroscopy and Imaging 5 (2016) 129–144

Bladder cancer is investigated in cooperation with the clinics of the Ruhr-University Bochum within the projects PURE (now ValBio) and UroFollow. We recently established the automated annotation of bladder tumors via FTIR imaging. A central question in the diagnosis of bladder cancer is the grading of the tumor, regarding the decision of a cystectomy. Here it is very hard to distinguish between a severe inflammation and a high grade carcinoma (carcinoma in situ). We achieved an automated label-free and observer independent characterization of bladder tissue using FTIR imaging. This robust and reproducible characterization is currently under validation within a huge cohort of patients.
The combination with -omics techniques shall allow deep insights into the biochemistry of bladder cancer. Promising first experiments have been performed and may pave the way to new and more precise biomarkers.
(159) Ollesch J., Heinze M., Heise H.M., Behrens T., Brüning T., Gerwert K.
It's in your blood: spectral biomarker candidates for urinary bladder cancer from automated FTIR spectroscopy
J. Biophotonics 7, No. 3-4 (2014) 210-221
Author biographies
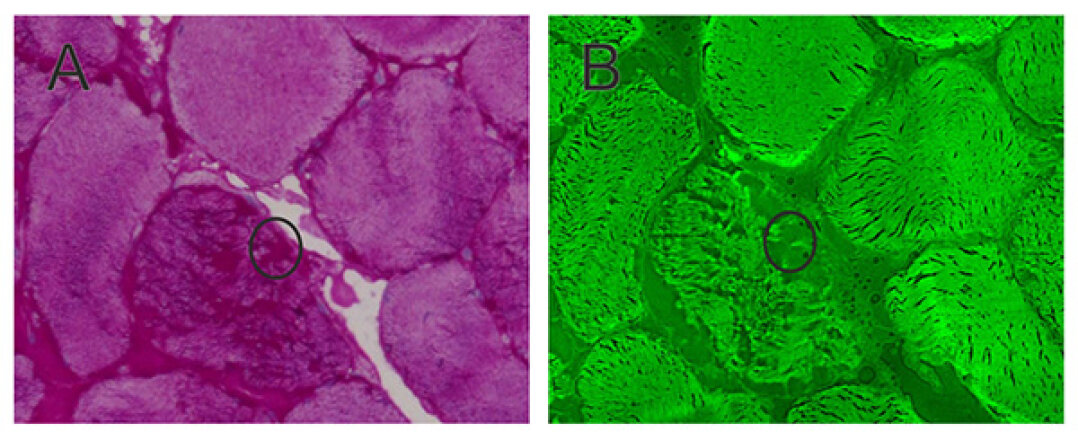
In this recently started project we aim to use vibrational spectroscopy to investigate the changes of the musculature suffering neurodegenerative diseases in cooperation with Prof. Dr. Matthias Vorgerd (Institute of Neurology, Bergmannsheil Hospital, Bochum). The focus is on the mechanism of protein-aggregation and the label-free differentiation of various muscular dystrophies. First attempts with Raman, CARS and FTIR imaging are very promising for future investigations.
